

TEMPERATURE TAPESTRY
A Climate Stripes Art Installation

This colorful art installation, inspired by Professor Ed Hawkins' Climate Stripes, displays 174 years of the global average temperature.Each stripe represents a year, forming a vibrant tapestry of colors. Notice the quick change from blue to red.
This illustrates how carbon pollution has had a dramatic ripple effect on Earth over the past decades. Our Temperature Tapestry Art Installation incorporates human events for context and highlights the significance of human choices and their impact on our planet.
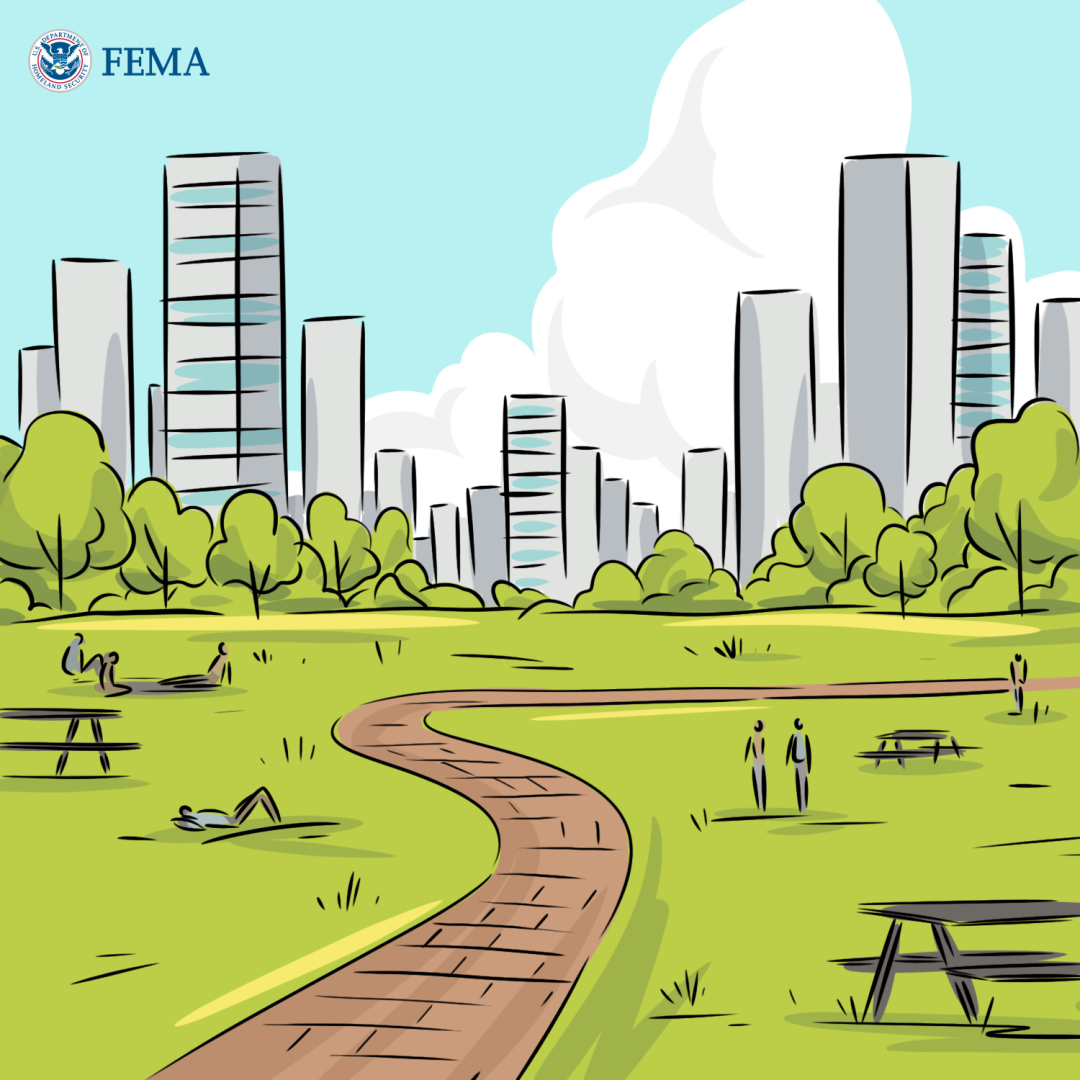
Looking at 175 years of temperature data might seem like a lot to take in. However, it SHOWS US THE POTENTIAL FOR POSITIVE CHANGE.What do you think people can do in the future to help cool things down? Nurturing more green spaces like Martin's Park in all areas of our cities can dramatically help. They reduce urban heat islands, provide shade, and enhance beauty and biodiversity in public spaces.
This project serves as a reminder that taking action is key to tackling climate change.
Whether it's individuals, families, communities, or governments, everyone has a role to play in shaping a better future for our planet. Creating small ripples of change for our environment involves making small yet impactful adjustments in our daily lives that will collectively contribute to a healthier planet.
INTERESTING ART INSTALLATION FACTS
90% of ribbon was purchased from family-owned businesses in CT, NJ & TN
〰️
All Materials will be cleaned, saved, reused, and/or repurposed
〰️
Excess or damaged textiles will be recycled properly
〰️
90% of ribbon was purchased from family-owned businesses in CT, NJ & TN 〰️ All Materials will be cleaned, saved, reused, and/or repurposed 〰️ Excess or damaged textiles will be recycled properly 〰️
17 colors of ribbon totaling 7,740'
〰️
774' of repurposed ribbon used from previous project
〰️
4 colors made of recycled plastic bottles
〰️
17 colors of ribbon totaling 7,740' 〰️ 774' of repurposed ribbon used from previous project 〰️ 4 colors made of recycled plastic bottles 〰️

OUR CLIMATE STRIPES CONTENT OVERVIEW
HOW CLIMATE CHANGE AFFECTS:
LET’S GET STARTED!
WHAT IS
CLIMATE CHANGE?
CAUSES
Manufacturing goods
Cutting down forests
Using fossil fuels
Consuming too much
Powering buildings
Generating power
Producing food
Climate change refers to long-term shifts in temperatures and weather patterns. These shifts may be natural, but since the 1800s, human activities have been the main driver of climate change, primarily due to the burning of fossil fuels (like coal, oil, and gas) which produces heat-trapping gasses.
EFFECTS
Hotter temperatures
Poverty and displacement
A warming, rising ocean
More severe storms
Increased drought
Loss of species
Not enough food
More health risks

You are never too young, or too old, to make a difference!
WHAT ARE
CLIMATE STRIPES?
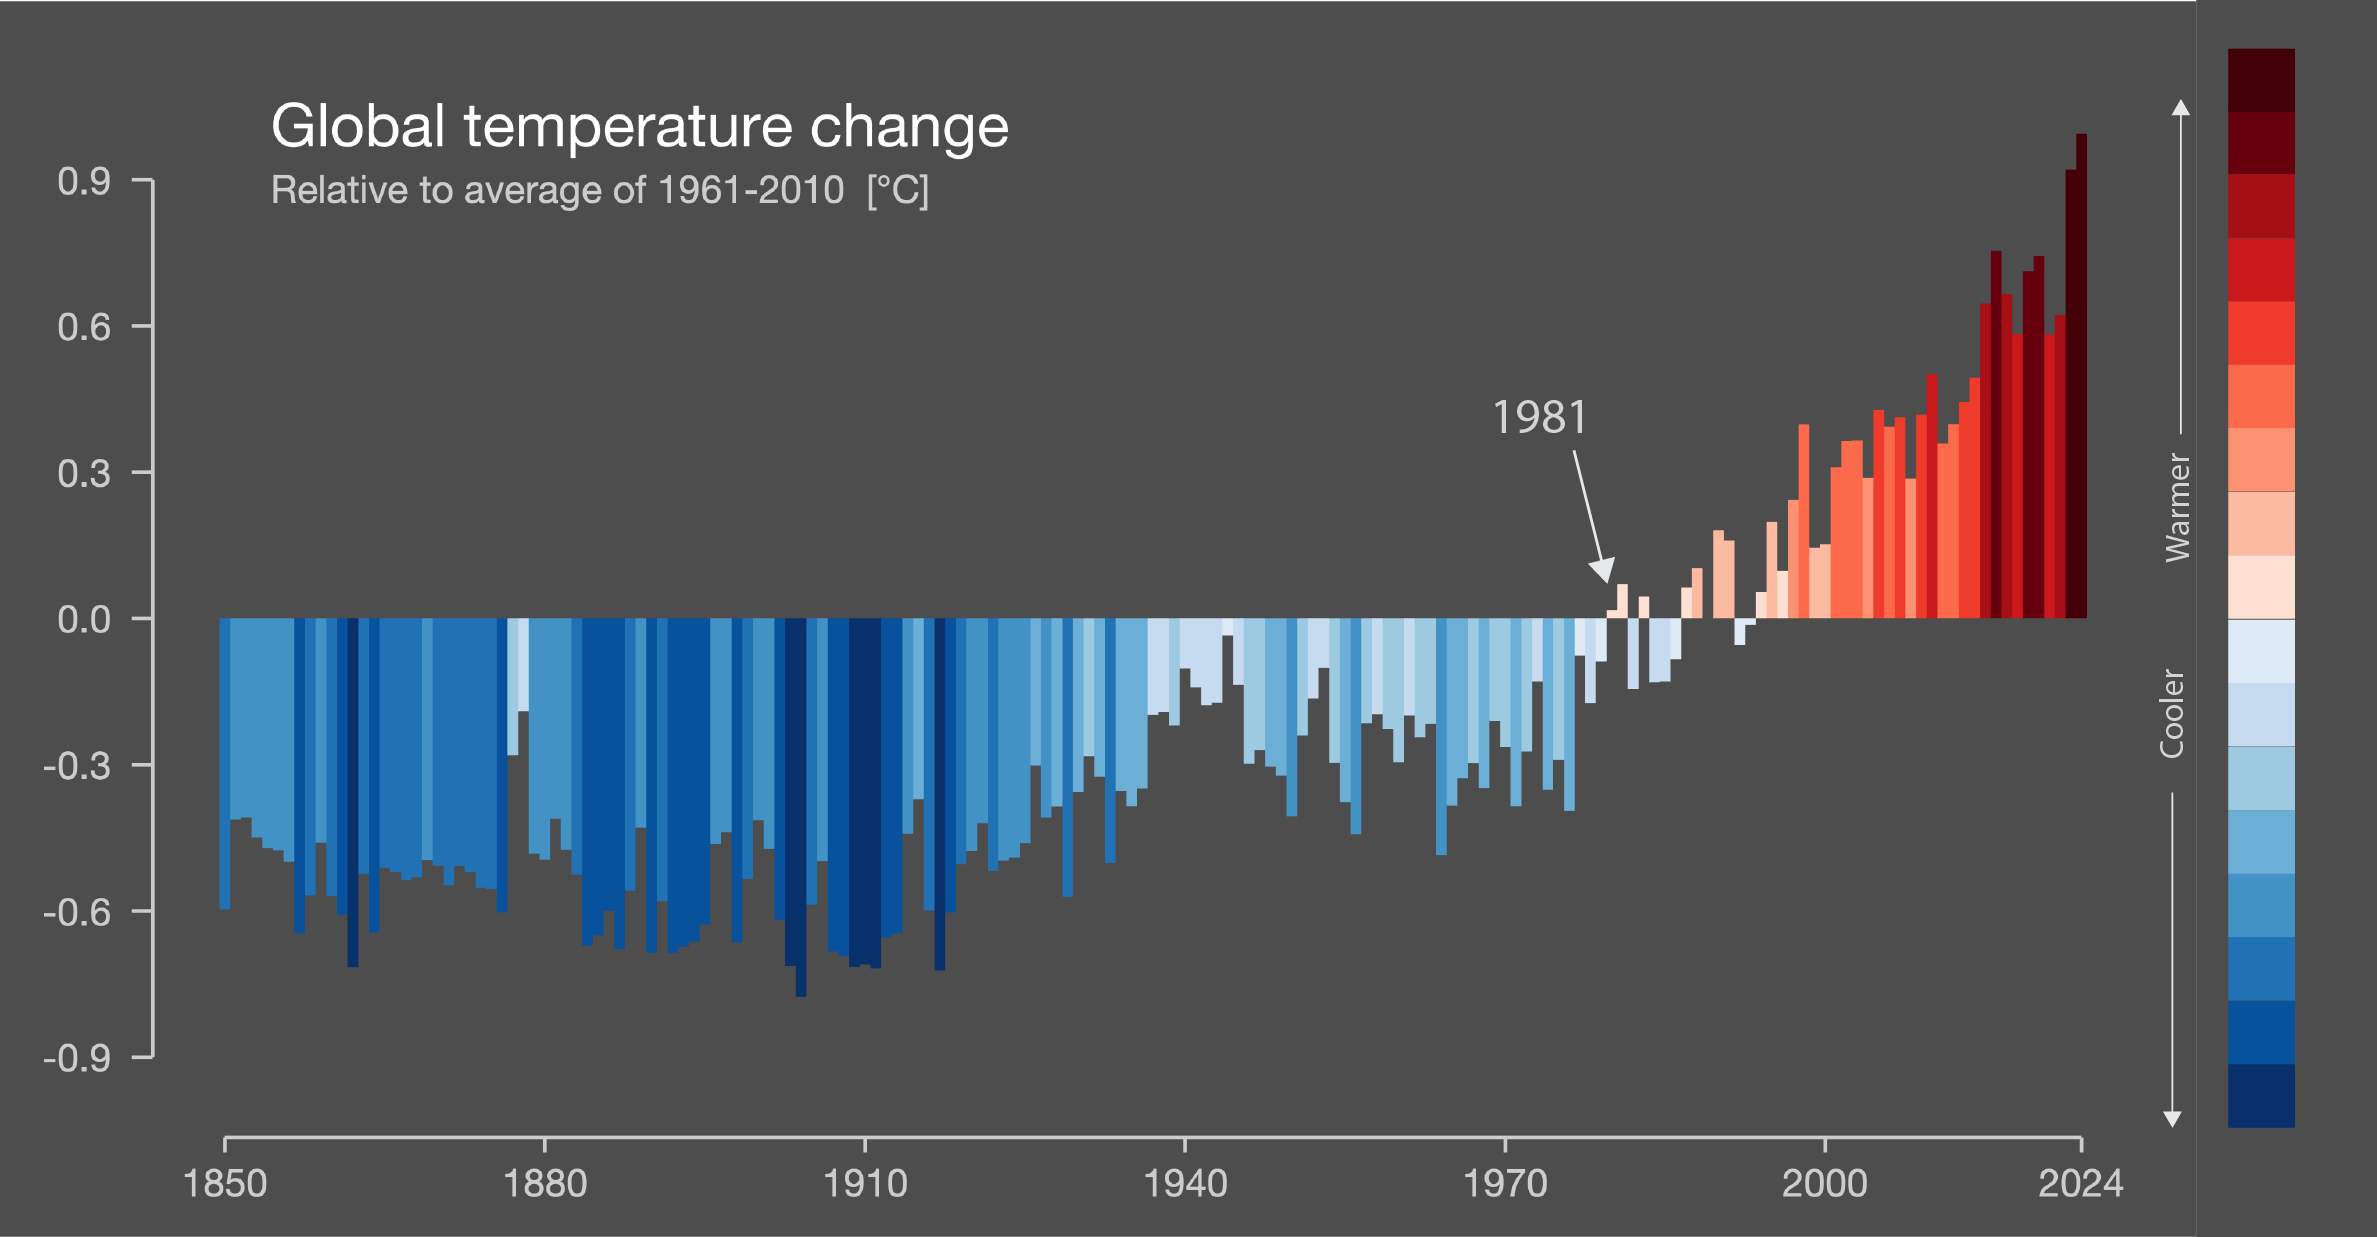
The Climate Stripes project was created by Professor Ed Hawkins, a climate scientist at the University of Reading, UK. The global warming stripes are a simple visual representation of the long-term rise in global temperatures due to human-caused climate change.
Each stripe represents the average global temperature for a single year, relative to the average temperature over the period as a whole, from 1850 to 2023. Shades of blue indicate cooler-than-average years, while red shows years that were hotter than the average.
The global warming stripes graphic shows a rapid shift from blue to red stripes in recent decades as carbon pollution has warmed the planet.
"The climate stripes are all about starting conversations about climate change, and 2024 has to be the year we turn conversations into faster action. The good news is that we already have many of the solutions we need. We now need bold, transformative change across all parts of society to make our planet's climate safer for current and future generations." - Professor Hawkins
The year 2023 was the warmest year since global records began in 1850 at 2.12°F above the 20th-century average of 57.0°F. This value is 0.27°F more than the previous record set in 2016.
The year 2023 was the warmest year since global records began in 1850 at 2.12°F above the 20th century average of 57.0°F. This value is 0.27°F more than the previous record set in 2016.

The 10 warmest years in the 174-year record have all occurred during the last decade (2014-2023). The year 2010, which had surpassed 2005 at the time, now ranks as the 11th-warmest year on record.
IMPORTANT TERMS WHEN UNDERSTANDING CLIMATE CHANGE

HOW DOES
CLIMATE CHANGE AFFECT PARTS OF THE U.S.?
Climate change affects different parts of the U.S. in different ways. Some impacts are summarized here.
NORTHWEST
Changes in the timing of peak flows in rivers and streams are reducing water supplies and worsening competing demands for water. Communities are experiencing sea level rise, erosion, flooding, risks to infrastructure, and increasing ocean acidity. There has been an increase of wildfire incidence and severity, heatwaves, insect outbreaks, and tree diseases are causing widespread forest die-off.

MIDWEST
Extreme heat, heavy downpours, flooding, and wildfires affect infrastructure, health, agriculture, forestry, transportation, air and water quality/supply, and more.
NORTHEAST
Heat waves, heavy downpours, and sea level rise pose increased challenges to many aspects of life in the Northeast. Infrastructure, agriculture, fisheries, and ecosystems are increasingly compromised.

SOUTHWEST
Increasing heat, drought, and insect outbreaks have made wildfires more numerous and severe. The warming climate has also caused a decline in water supplies, reduced agricultural yields, and triggered heat-related health impacts in cities. In coastal areas, there have been extensive flooding and erosion.
ALASKA
Alaska has warmed twice as fast as the rest of the nation, bringing widespread impacts. Sea ice is rapidly receding and glaciers are shrinking. Thawing permafrost is leading to more wildfire, and affecting infrastructure and wildlife habitat. Rising ocean temperatures and acidification will alter valuable marine fisheries.
SOUTHEAST
Sea level rise and coastal flooding pose widespread and continuing threats to the region's economy and environment. Extreme heat threatens human health, especially stressing urban communities. Heavy rain and longer dry spells reduce water supply and access.
HAWAI'I and the U.S. Affiliated Pacific Islands
Warmer oceans are leading to increased coral bleaching and disease outbreaks, and to changes in the distribution of tuna fisheries. Freshwater supplies will become more limited on many islands. Coastal flooding and erosion will increase. Mounting threats to food and water security, infrastructure, health, and safety are expected to lead to increasing human migration.
HOW DOES
CLIMATE CHANGE AFFECT BOSTON?
Climate change has shifted Boston's climate to one more like the Mid-Atlantic: mild, dry winters and hot summers with extreme variations in rainfall.
- Coastal Flooding, even in calm weather
- Polluted stormwater and waterways
- Urban Heat Island Effect
Credit: NPS
HOW IS
Martin’s Park climate-ready?
During Martin's Park construction process, climate change - and the potential for flooding along the waterfront - became a very real issue as outlined in the findings of the Climate Ready Boston Report (2016) that raised the flood elevation for the site.
The Resilient Boston Harbor plan laid out strategies along Boston's 47-mile shoreline to increase access and open space along the waterfront while better protecting the city during a major flooding event.
Since Martin's Park was designed using previously released flood elevations, the Parks Department had to plan for future resiliency by going back to the drawing board to account for potential changes to the harbor in the face of rising water levels.
Additional design and engineering work was needed to make sure that the finished park took into consideration this information and to plan for future resiliency.
Credit: City of Boston
WHAT ARE
NATURE-BASED SOLUTIONS FOR CLIMATE CHANGE?
Nature-based solutions are sustainable planning, design, environmental management and engineering practices that weave natural features or processes into the built environment to promote adaptation and resilience. [1]
Right here in Boston, The Stone Living Lab is using nature-based projects that work to address major problems such as climate change, flooding, and erosion. These projects protect, restore, or improve the environment to tackle challenges.
Examples of nature-based solutions SLL uses:
Protecting wetlands to shield communities from sea level rise, flooding, and erosion.
Planting trees in cities to address heat waves and capture rainwater.
Installing green roofs (roofs with plants) to reduce air pollution. [2]
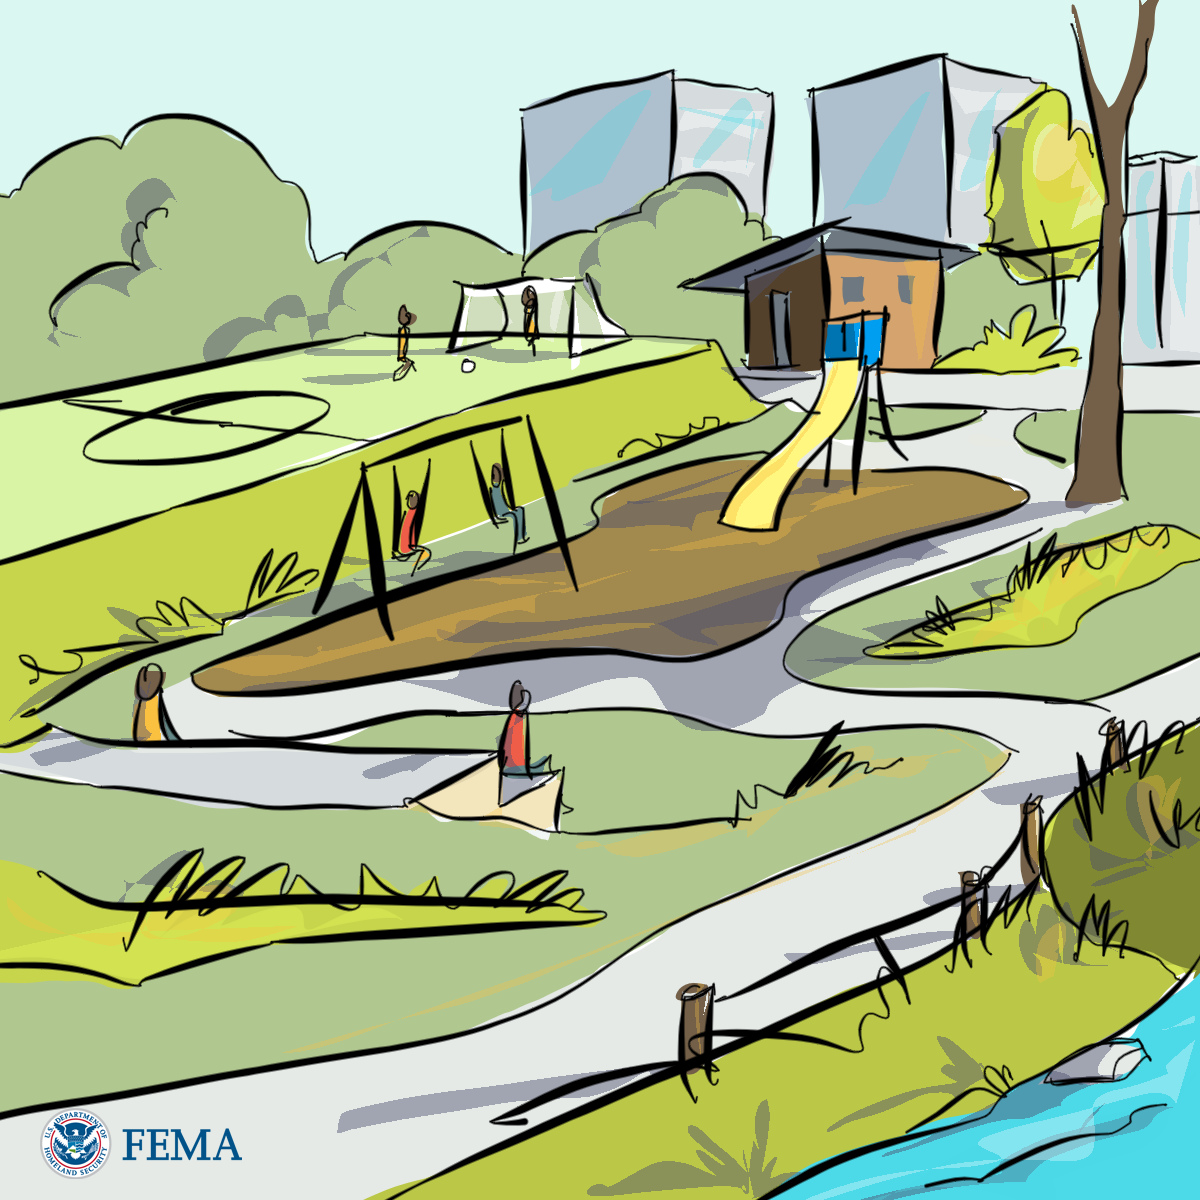

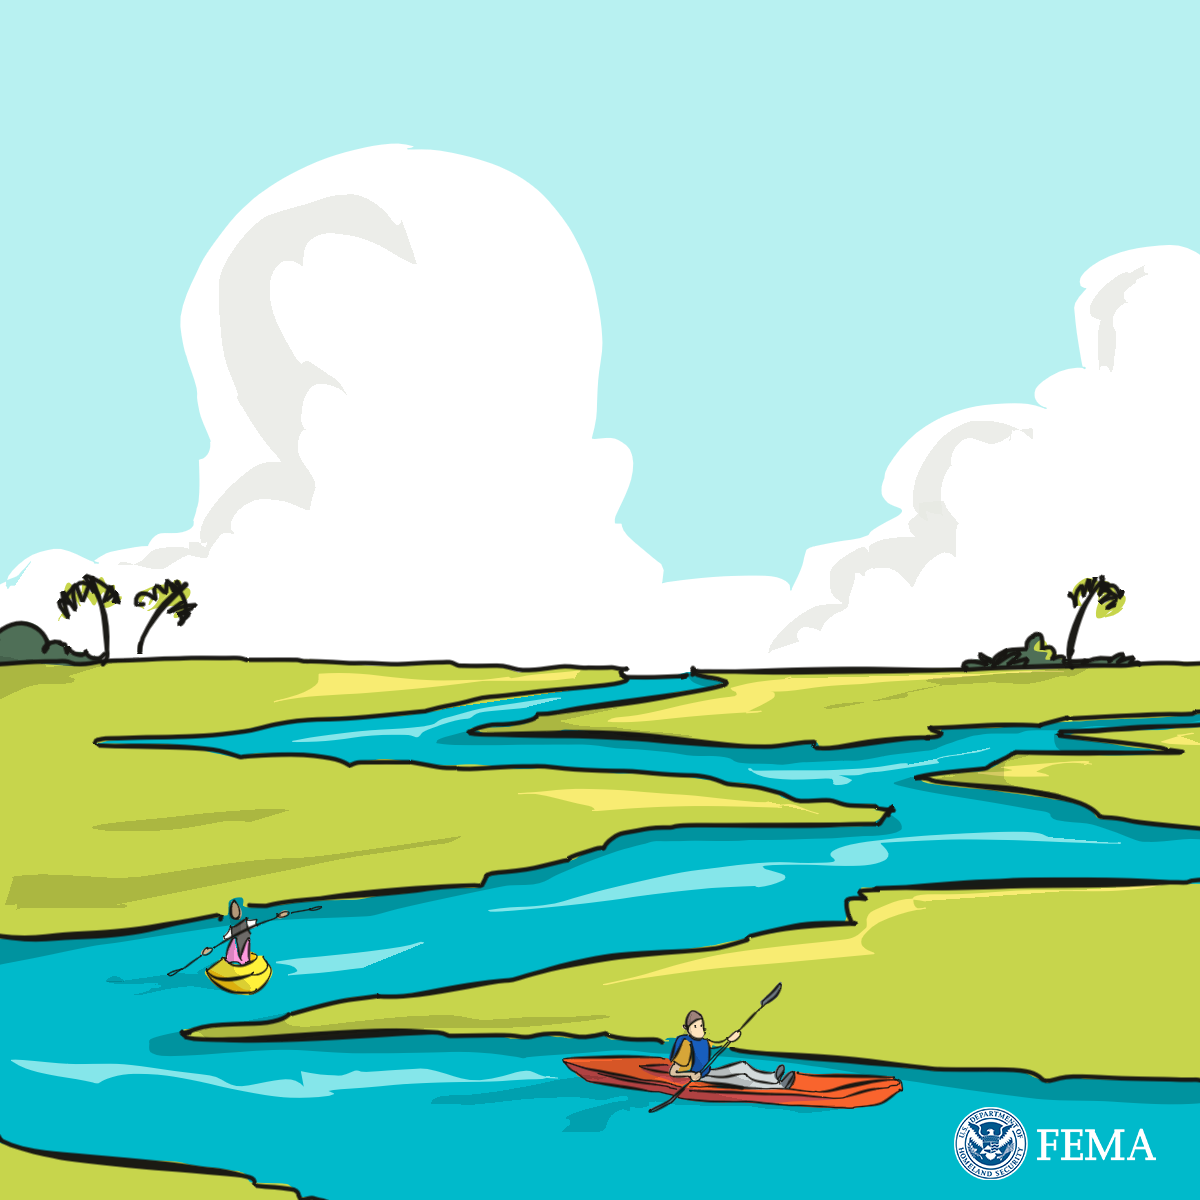
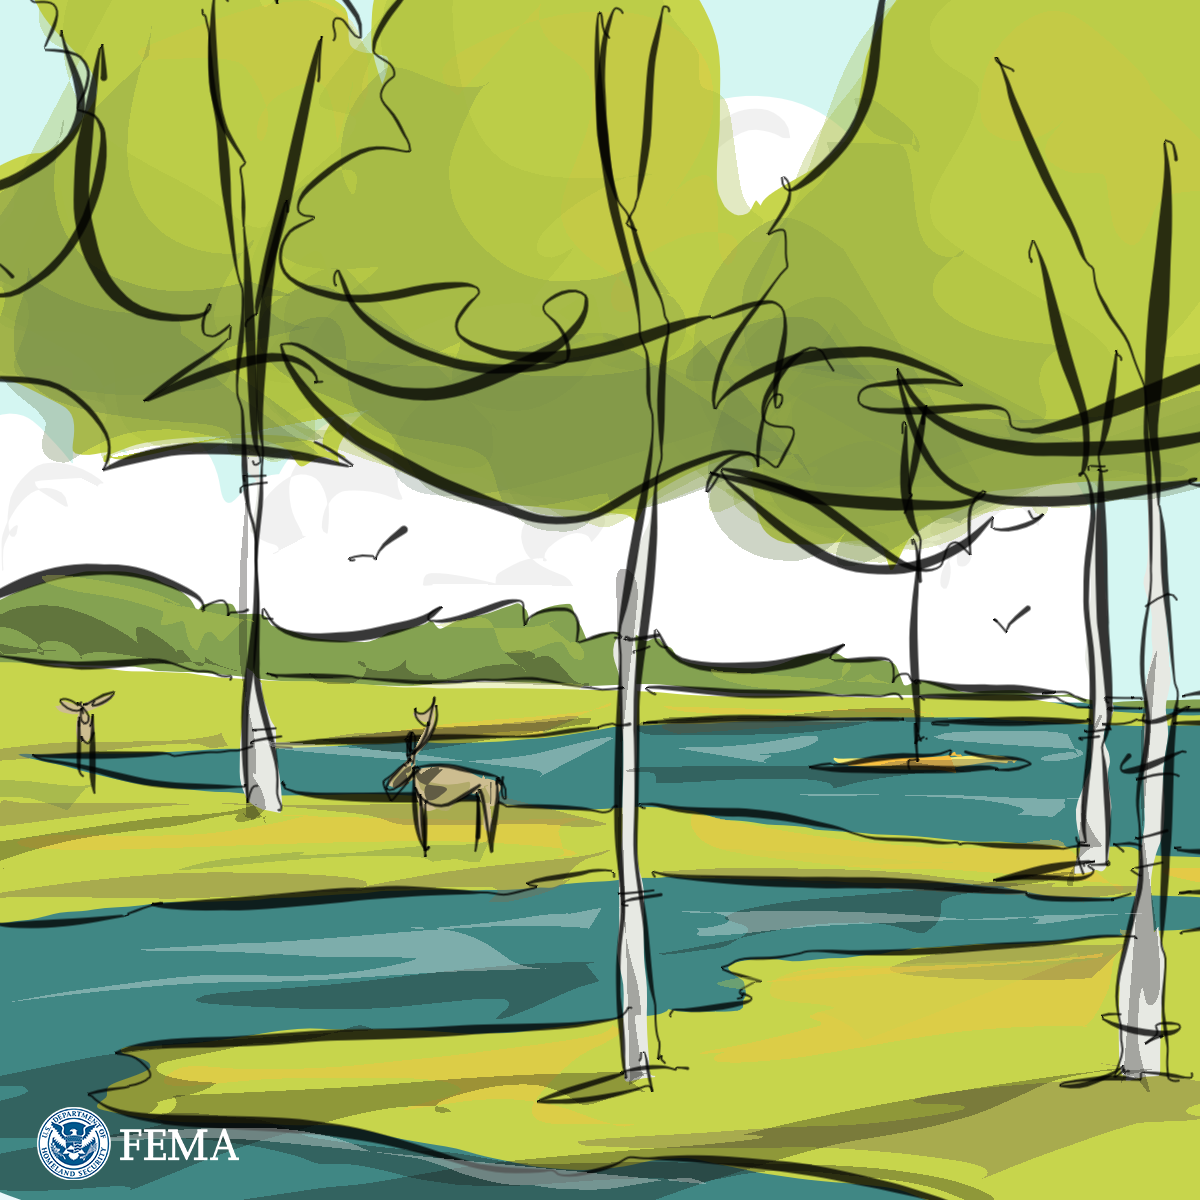
STORMWATER PARKS are recreational spaces that are designed to flood during extreme events and to withstand flooding. By storing and treating floodwaters, stormwater parks can reduce flooding elsewhere and improve water quality.
HABITAT MANAGEMENT
Healthy lands can absorb shocks and repair themselves after storms and other hazards. Managing a habitat can help it better absorb flood waters and improve water quality. It also reduces fire risk, prevents erosion and provides many other benefits.
You can manage a habitat with both natural and mechanical methods.
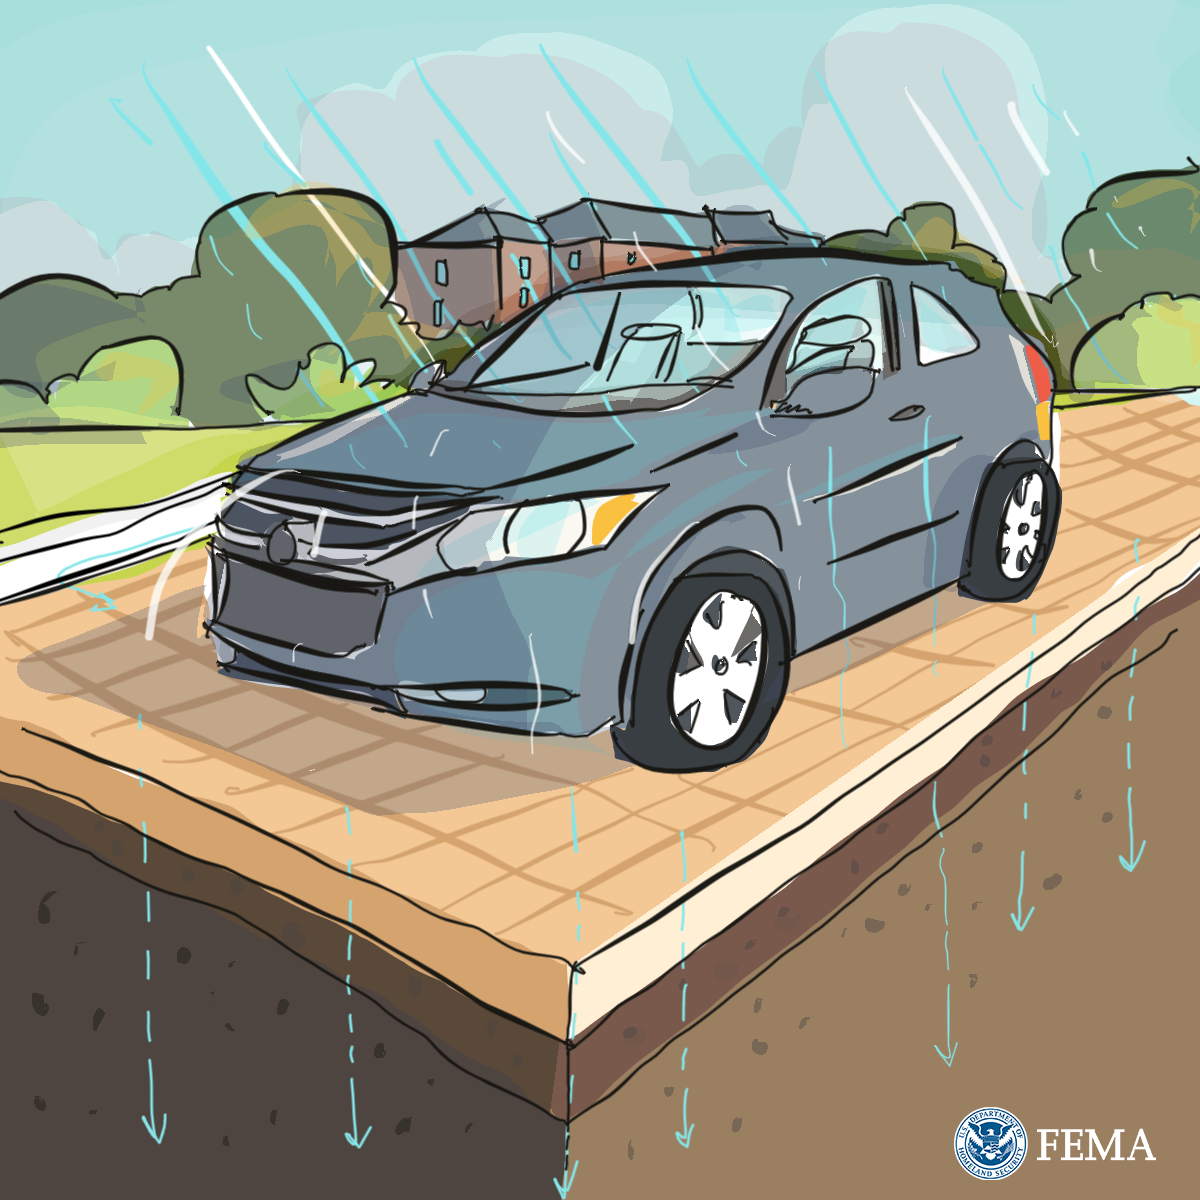
PERMEABLE PAVEMENT allow more rainfall to soak into the ground. Common types include pervious concrete, porous asphalt, and interlocking pavers.
Permeable pavements are most commonly used for parking lots and roadway shoulders.
COASTAL WETLANDS are found along ocean, estuary, or freshwater coastlines.
They are often referred to as “sponges” because of their ability to absorb wave energy during storms or normal tide cycles.
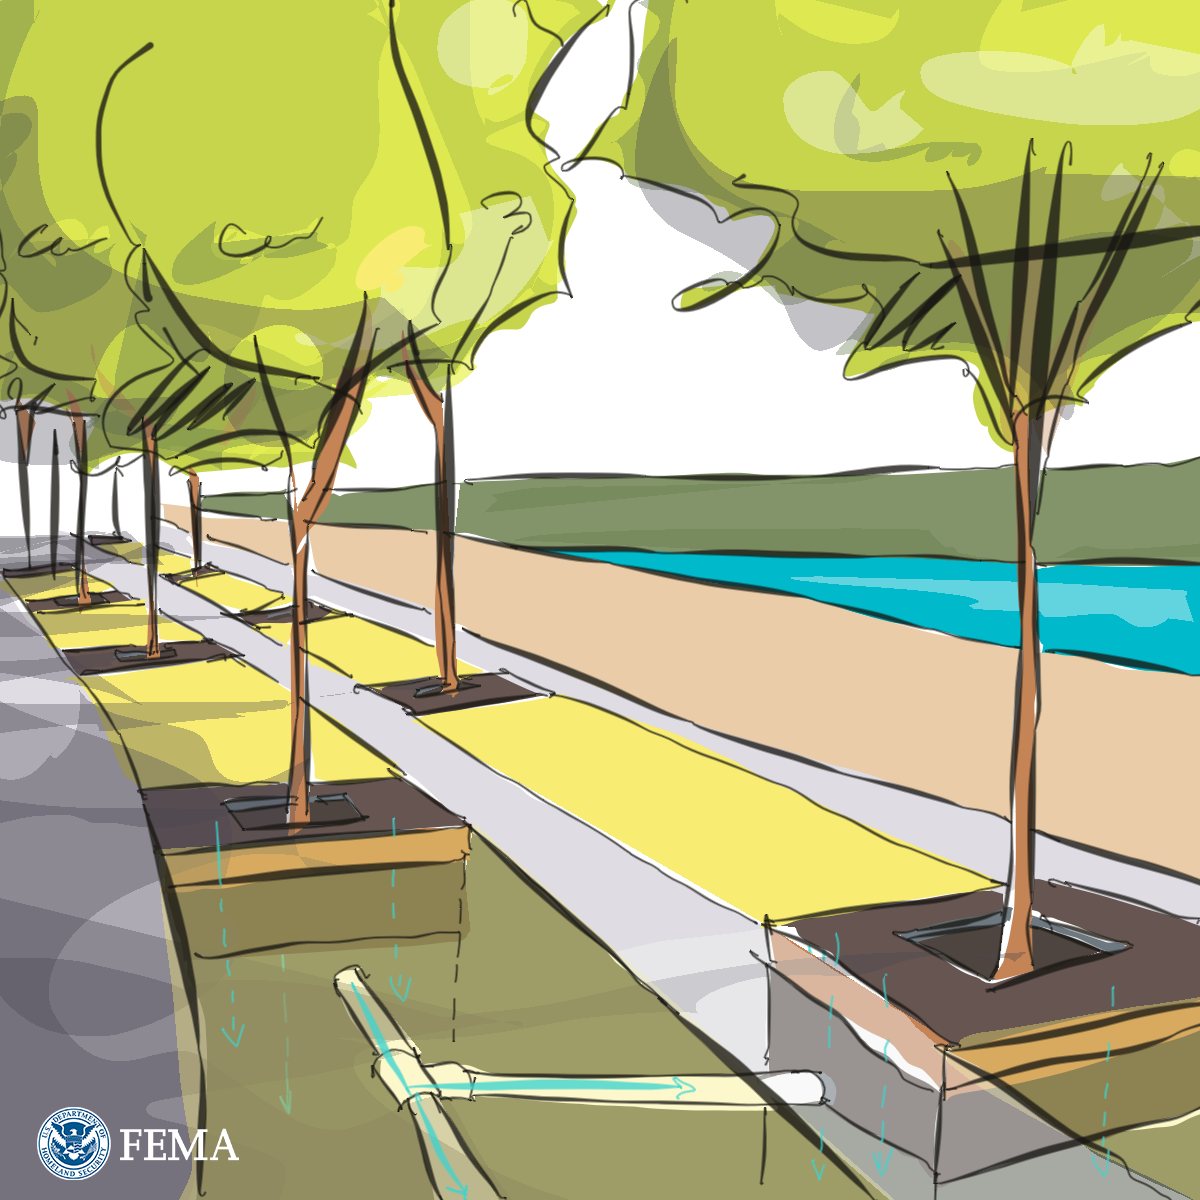
Stormwater TREE TRENCHES are a row of trees planted in an underground infiltration structure made to store and filter stormwater.
Tree trenches can be added to streets and parking lots with limited space to manage stormwater.
OYSTER REEFS are often referred to as “ecosystem engineers” because of their tendency to attach to hard surfaces and create large reefs made of thousands of individuals.
In addition to offering shelter and food to coastal species, oyster reefs buffer coasts from waves and filter surrounding waters.
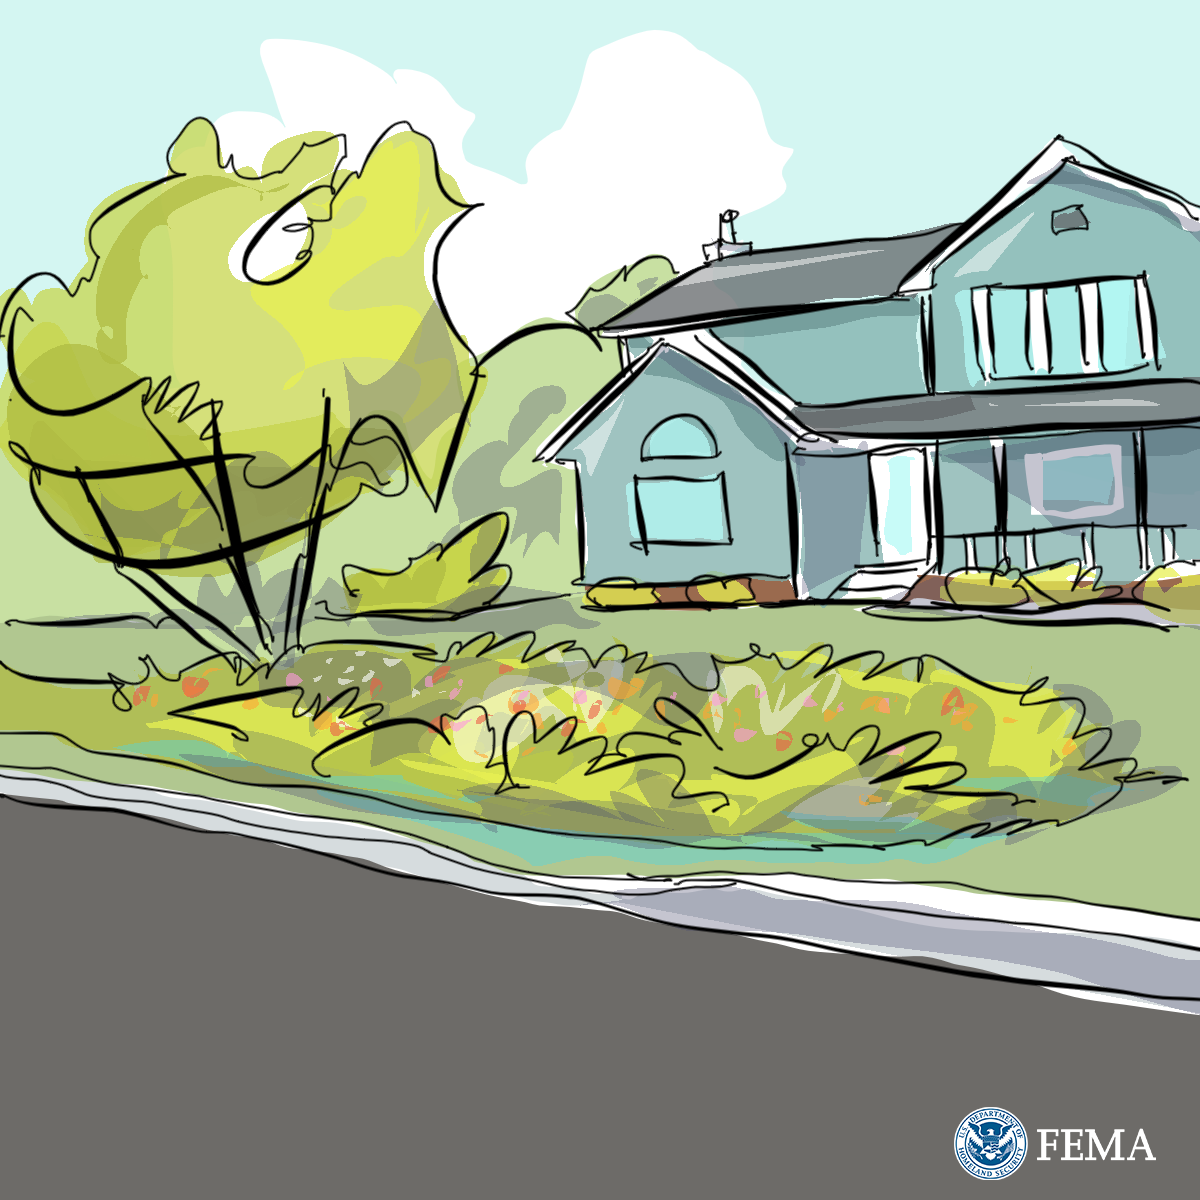
RAIN GARDENS are shallow, vegetated basins that collect and absorb runoff from rooftops, sidewalks, and streets.
Rain gardens can be added around homes and businesses to reduce and treat stormwater runoff.
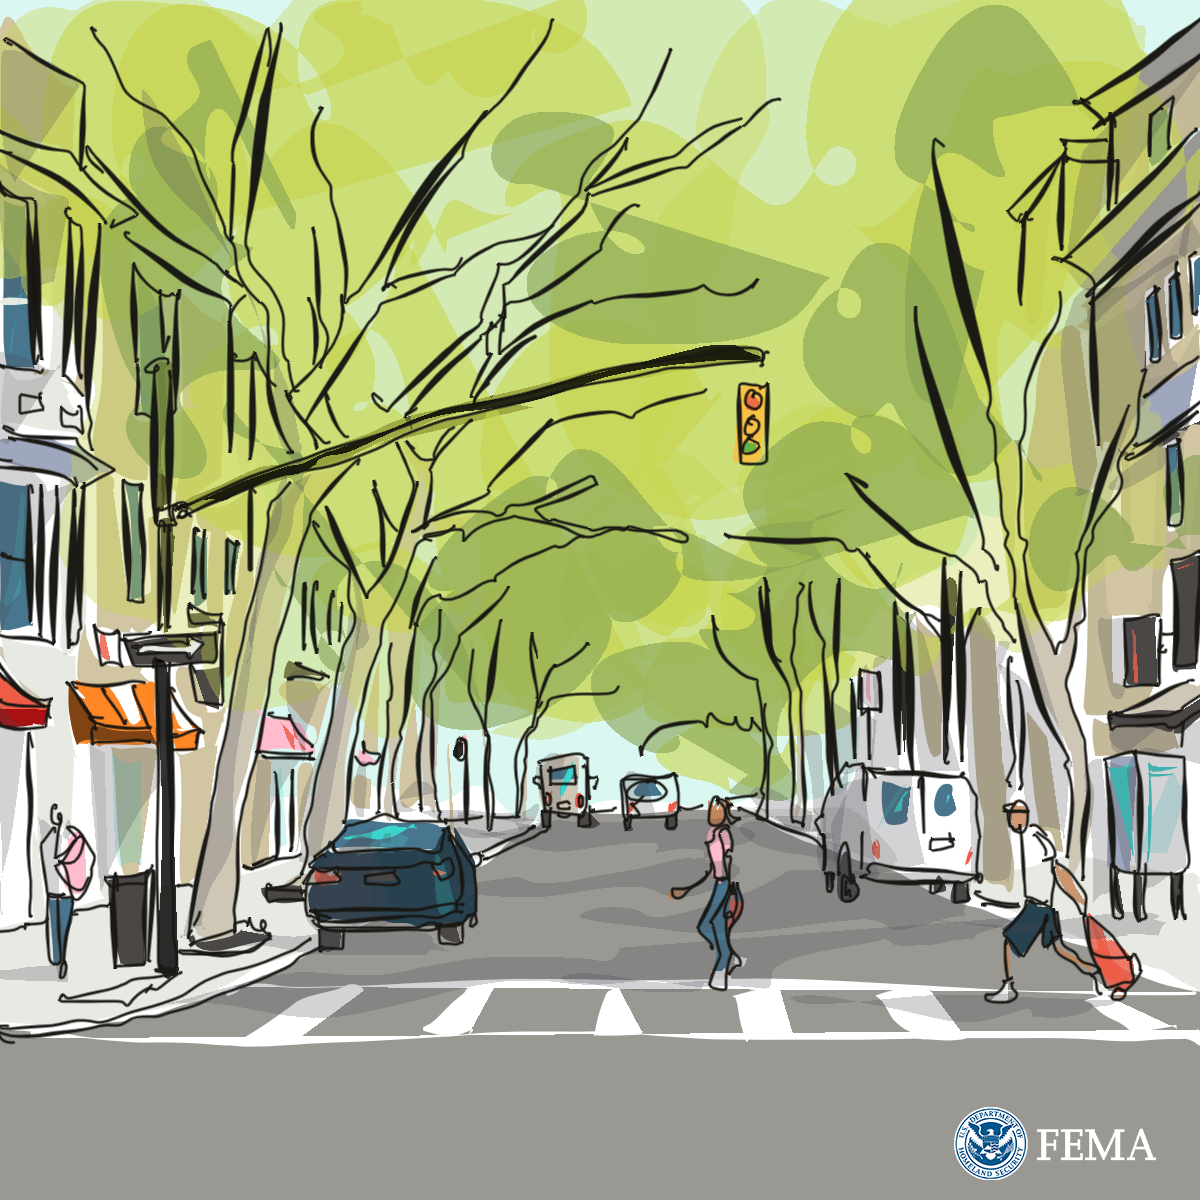
A TREE CANOPY can reduce stormwater runoff by catching rainfall on branches and leaves and increasing evapotranspiration. By keeping neighborhoods cooler in the summer, tree canopy can also reduce the “urban heat island effect.”
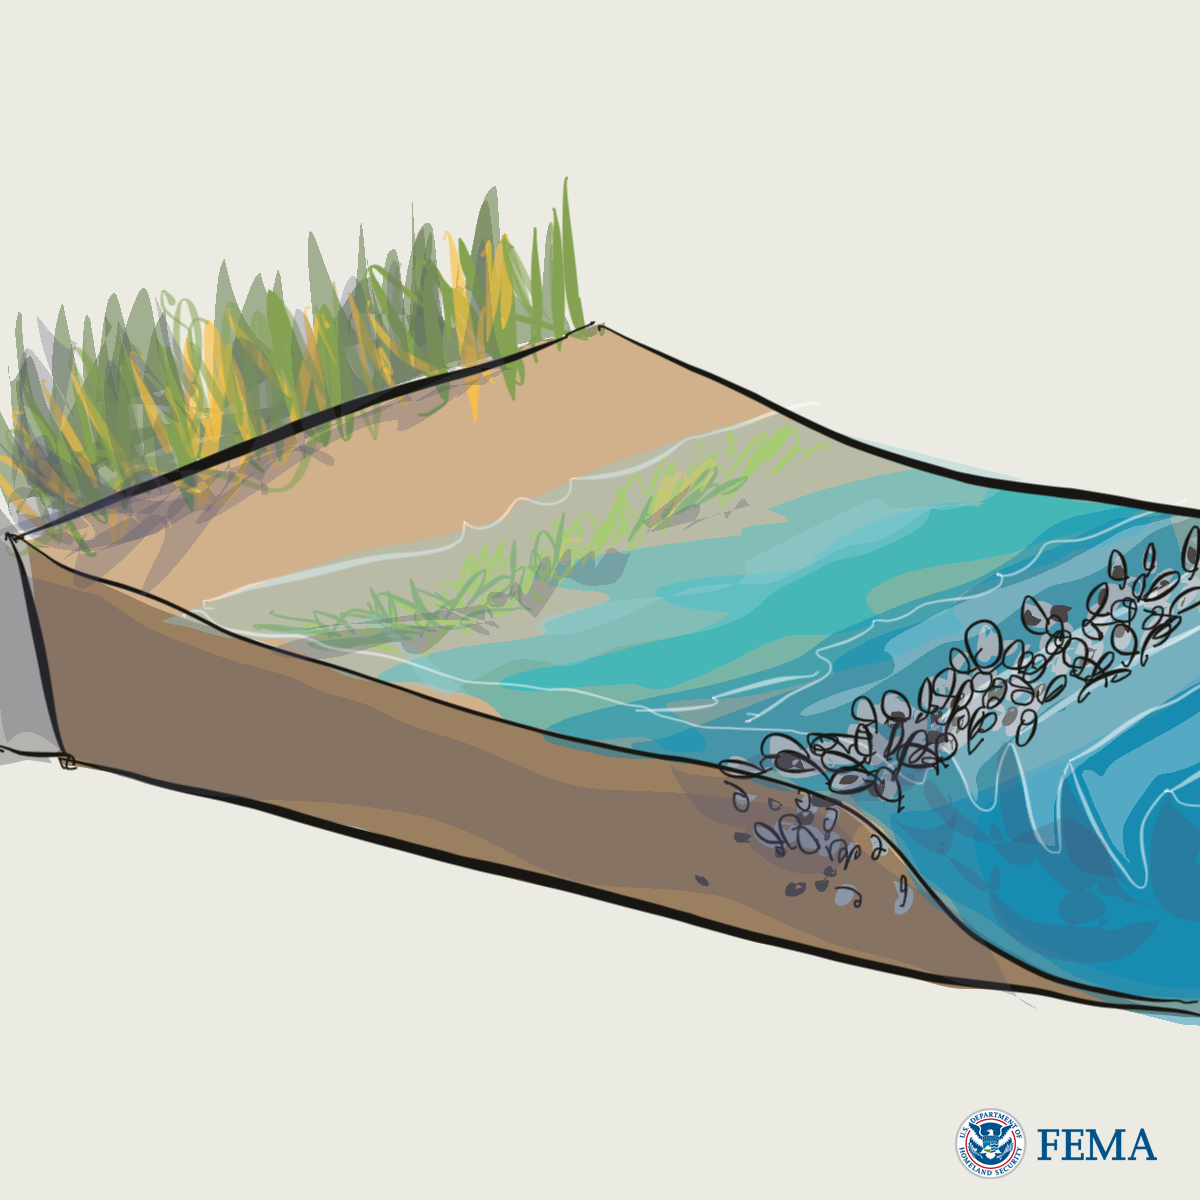
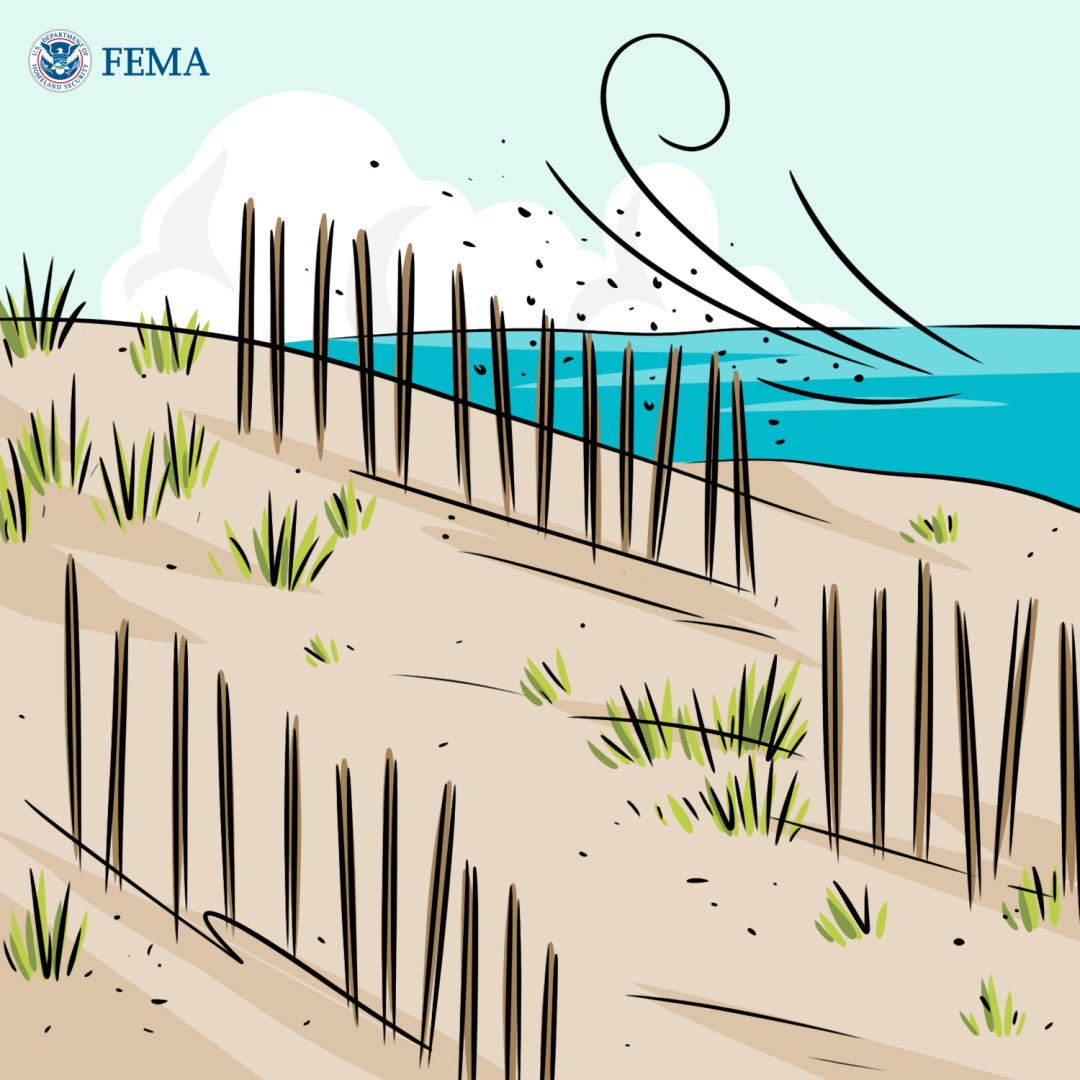
SAND TRAPPING is a method to make and support coastal dunes. Sand trapping fencing helps to build up the front of a dune.
Healthy dunes serve as a natural barrier between the coastline and inland areas. They reduce flooding and provide habitat for coastal animals and plants.
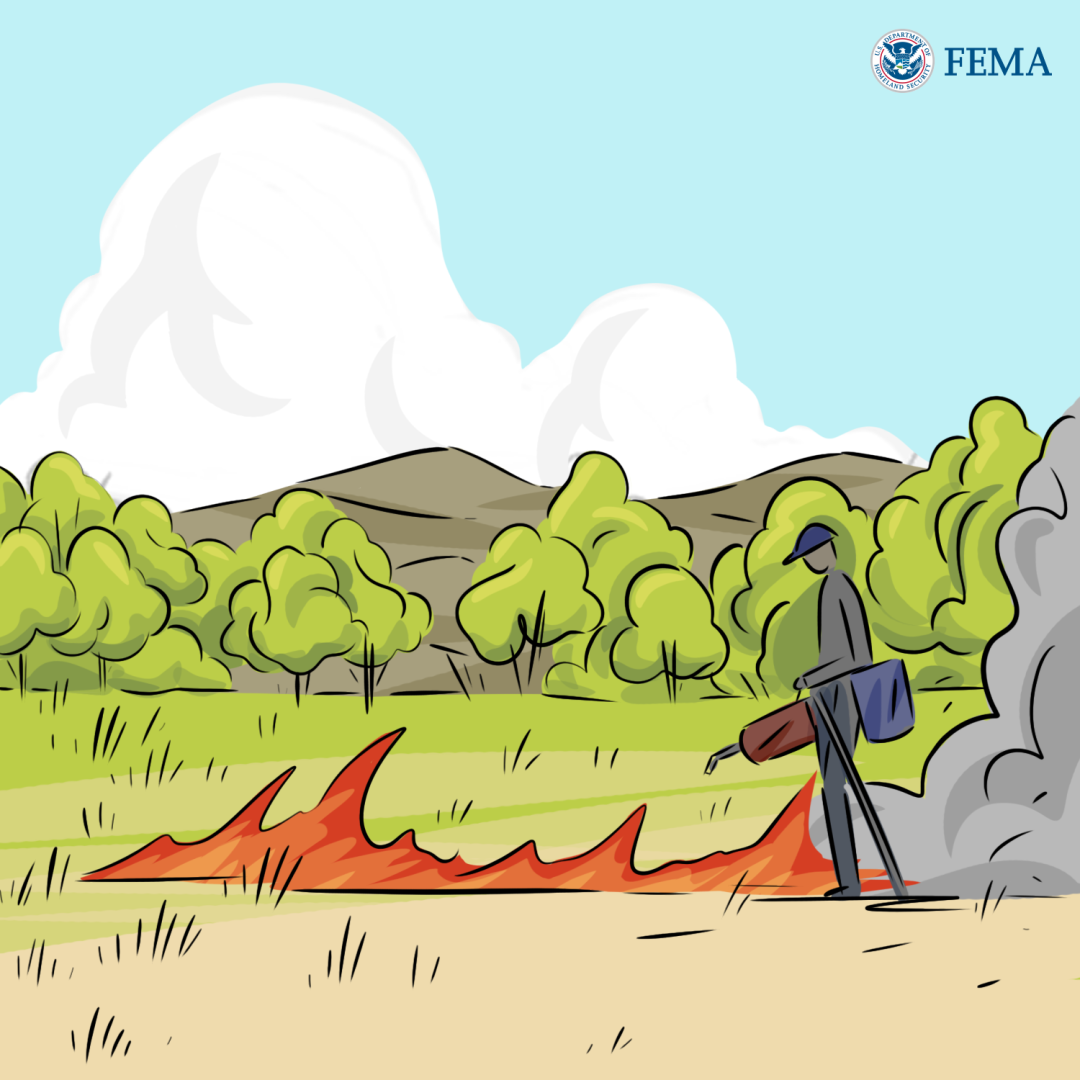
FIRE MANAGEMENT, like storms, fires are a natural part of a healthy landscape. Methods like prescribed burns decrease the amount of brush and other fuels. This helps to reduce the severity of fires. You can also use mechanical methods in fire management.
Proactively managing land for fire makes humans safer and landscapes healthier.
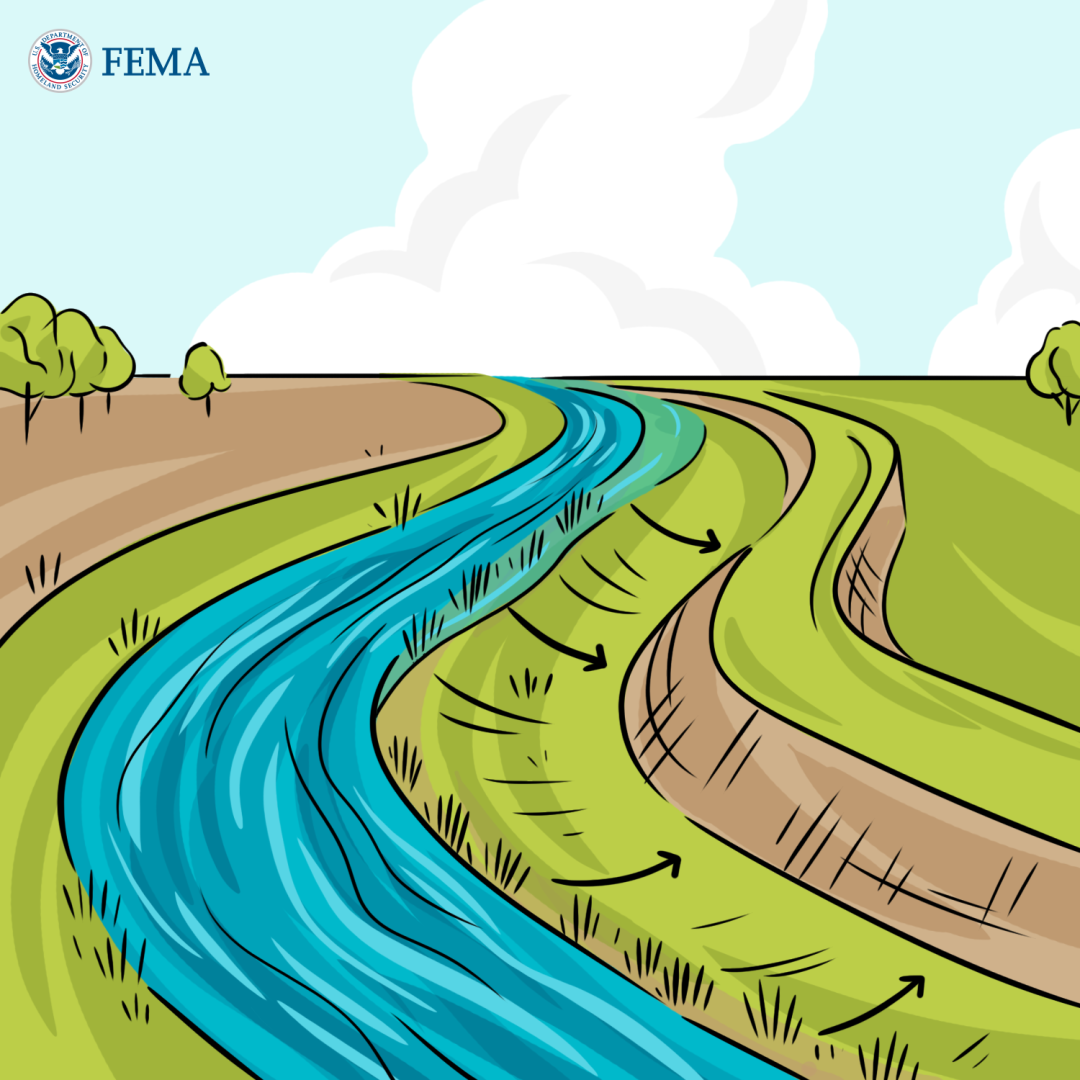
SETBACK LEVEES provide a vertical barrier against storm surge or river overtopping. A setback moves the levee away from the river or coast. This provides extra space for floodwater.
Setback levees provide extra flood protection and reduce erosion. They also support healthier and more dynamic river and coastal systems.
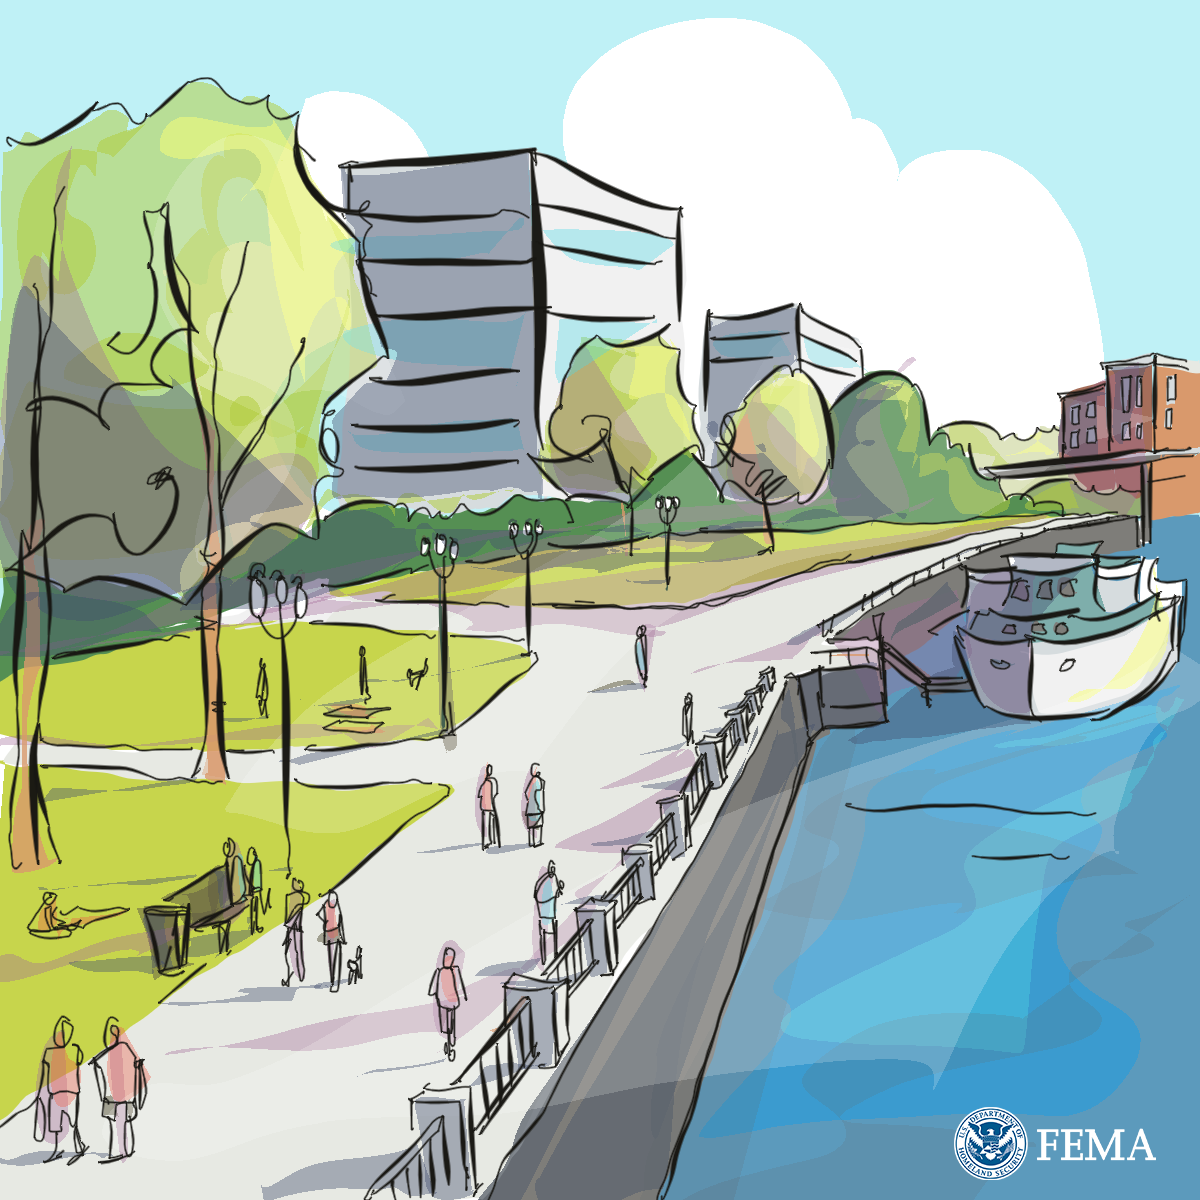
WATERFRONT PARKS in coastal areas can be intentionally designed to flood during extreme events, reducing flooding elsewhere.
Waterfront parks can also absorb the impact from tidal or storm flooding and improve water quality.
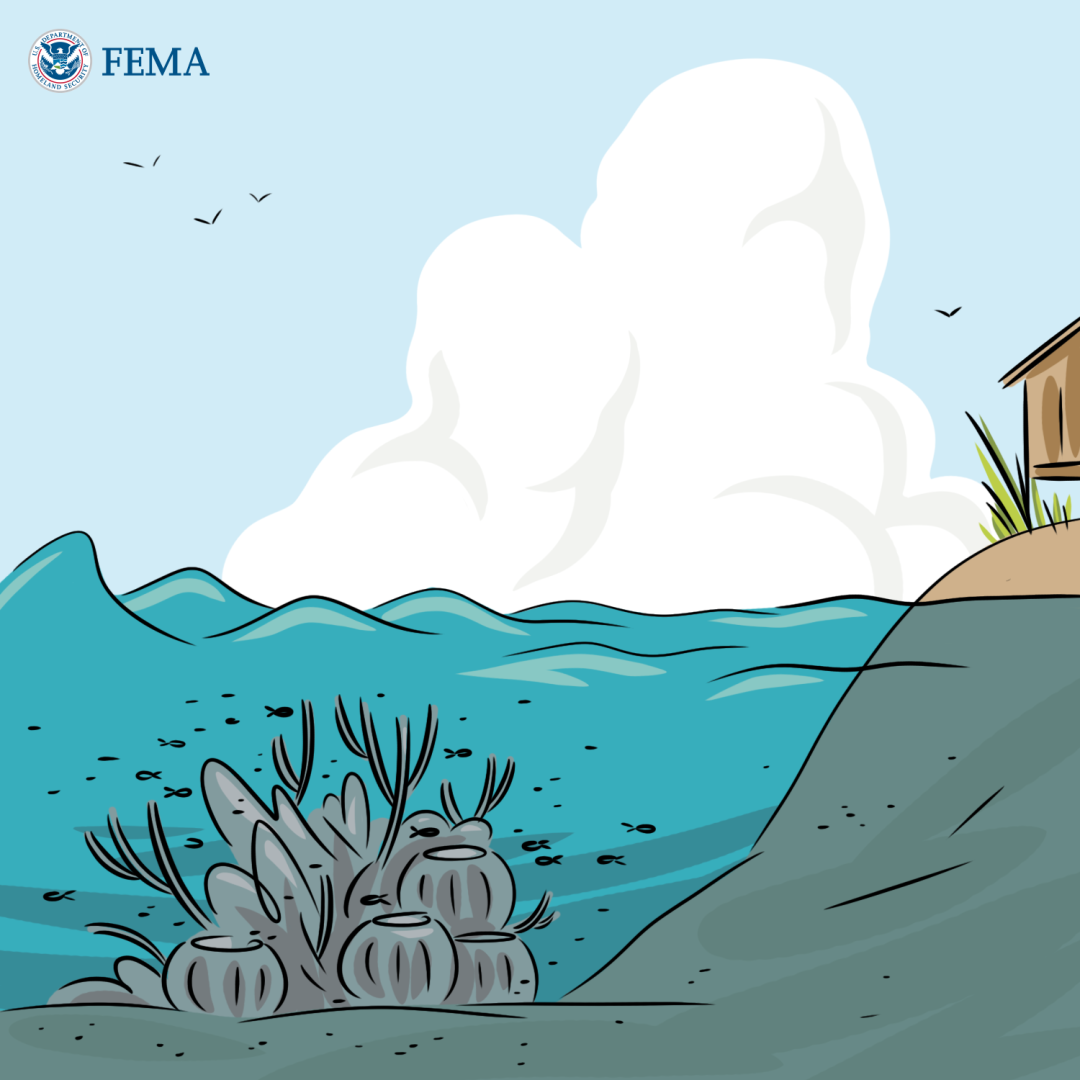
CORAL REEFS serve as a natural breakwater. They absorb wave energy and protect the coast from erosion and flooding.
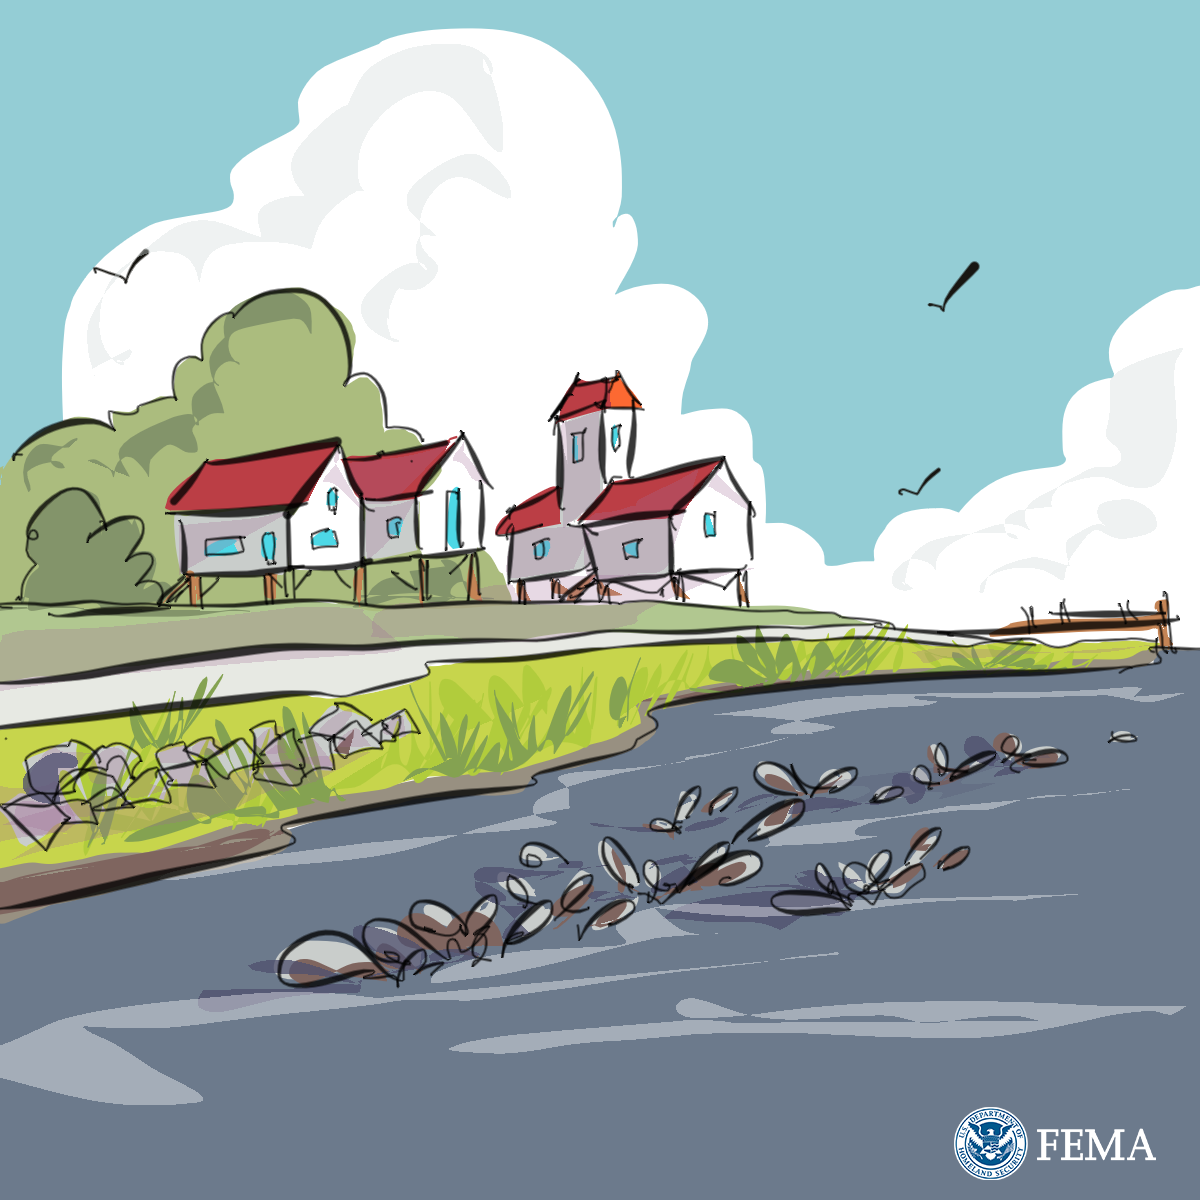
LIVING SHORELINES stabilize a shore by combining living components, such as plants, with structural elements, such as rock or sand.
Living shorelines can slow waves, reduce erosion, and protect coastal property.
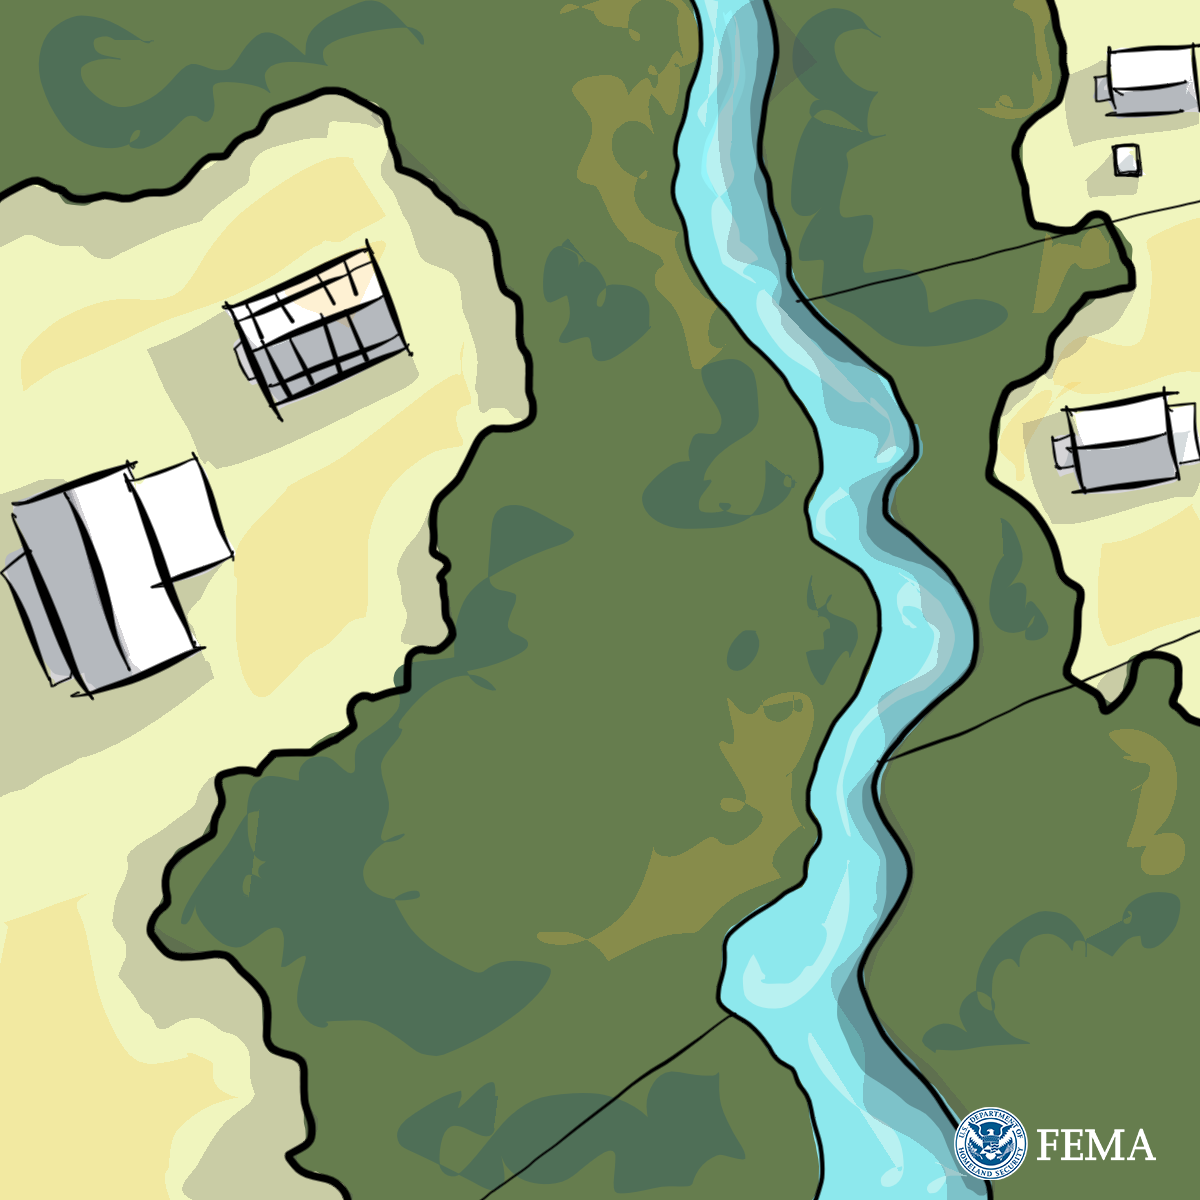
LAND CONSERVATION is one way of preserving interconnected systems of open space that sustain healthy communities.
Land conservation projects begin by prioritizing areas of land for acquisition. Land or conservation easements can be bought or acquired through donation.
URBAN GREENSPACE reduces the urban heat island and improves air quality. They can also absorb flood waters to reduce flooding elsewhere.
Greenspace also provides more recreational opportunities and beautifies a community.
WETLAND RESTORATION AND PROTECTION can improve water quality and reduce flooding. Healthy wetlands filter, absorb, and slow runoff.
Wetlands also sustain healthy ecosystems by recharging groundwater and providing habitat for fish and wildlife.
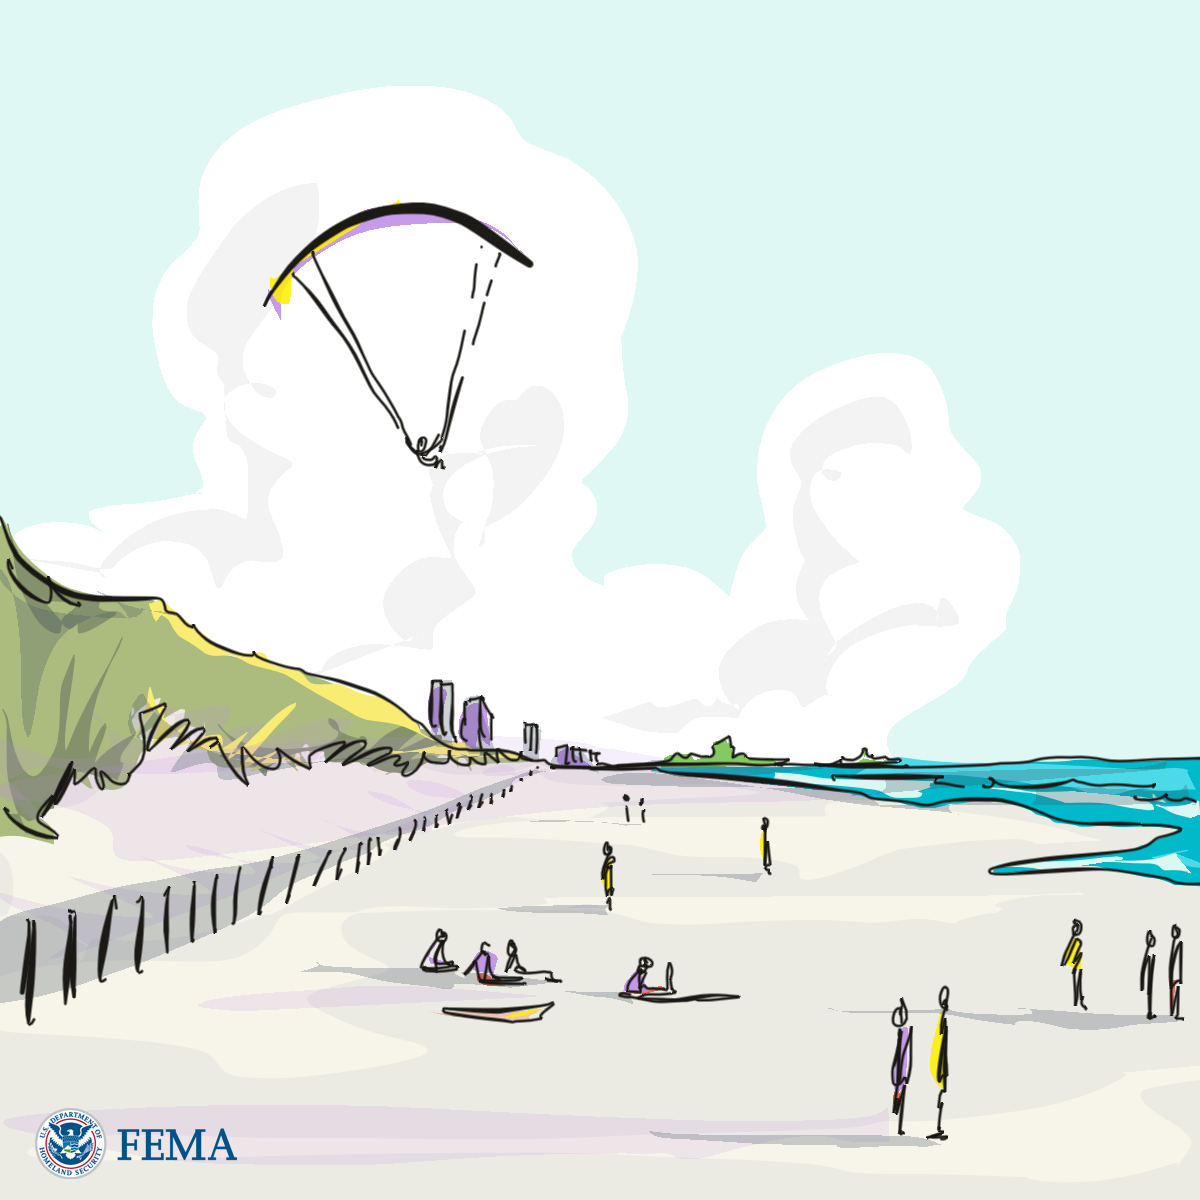
DUNES are coastal features made of blown sand. Healthy dunes
often have dune grasses or other vegetation to keep their shape.
Dunes can serve as a barrier between the water’s edge and inland areas, buffering waves as a first line of defense.